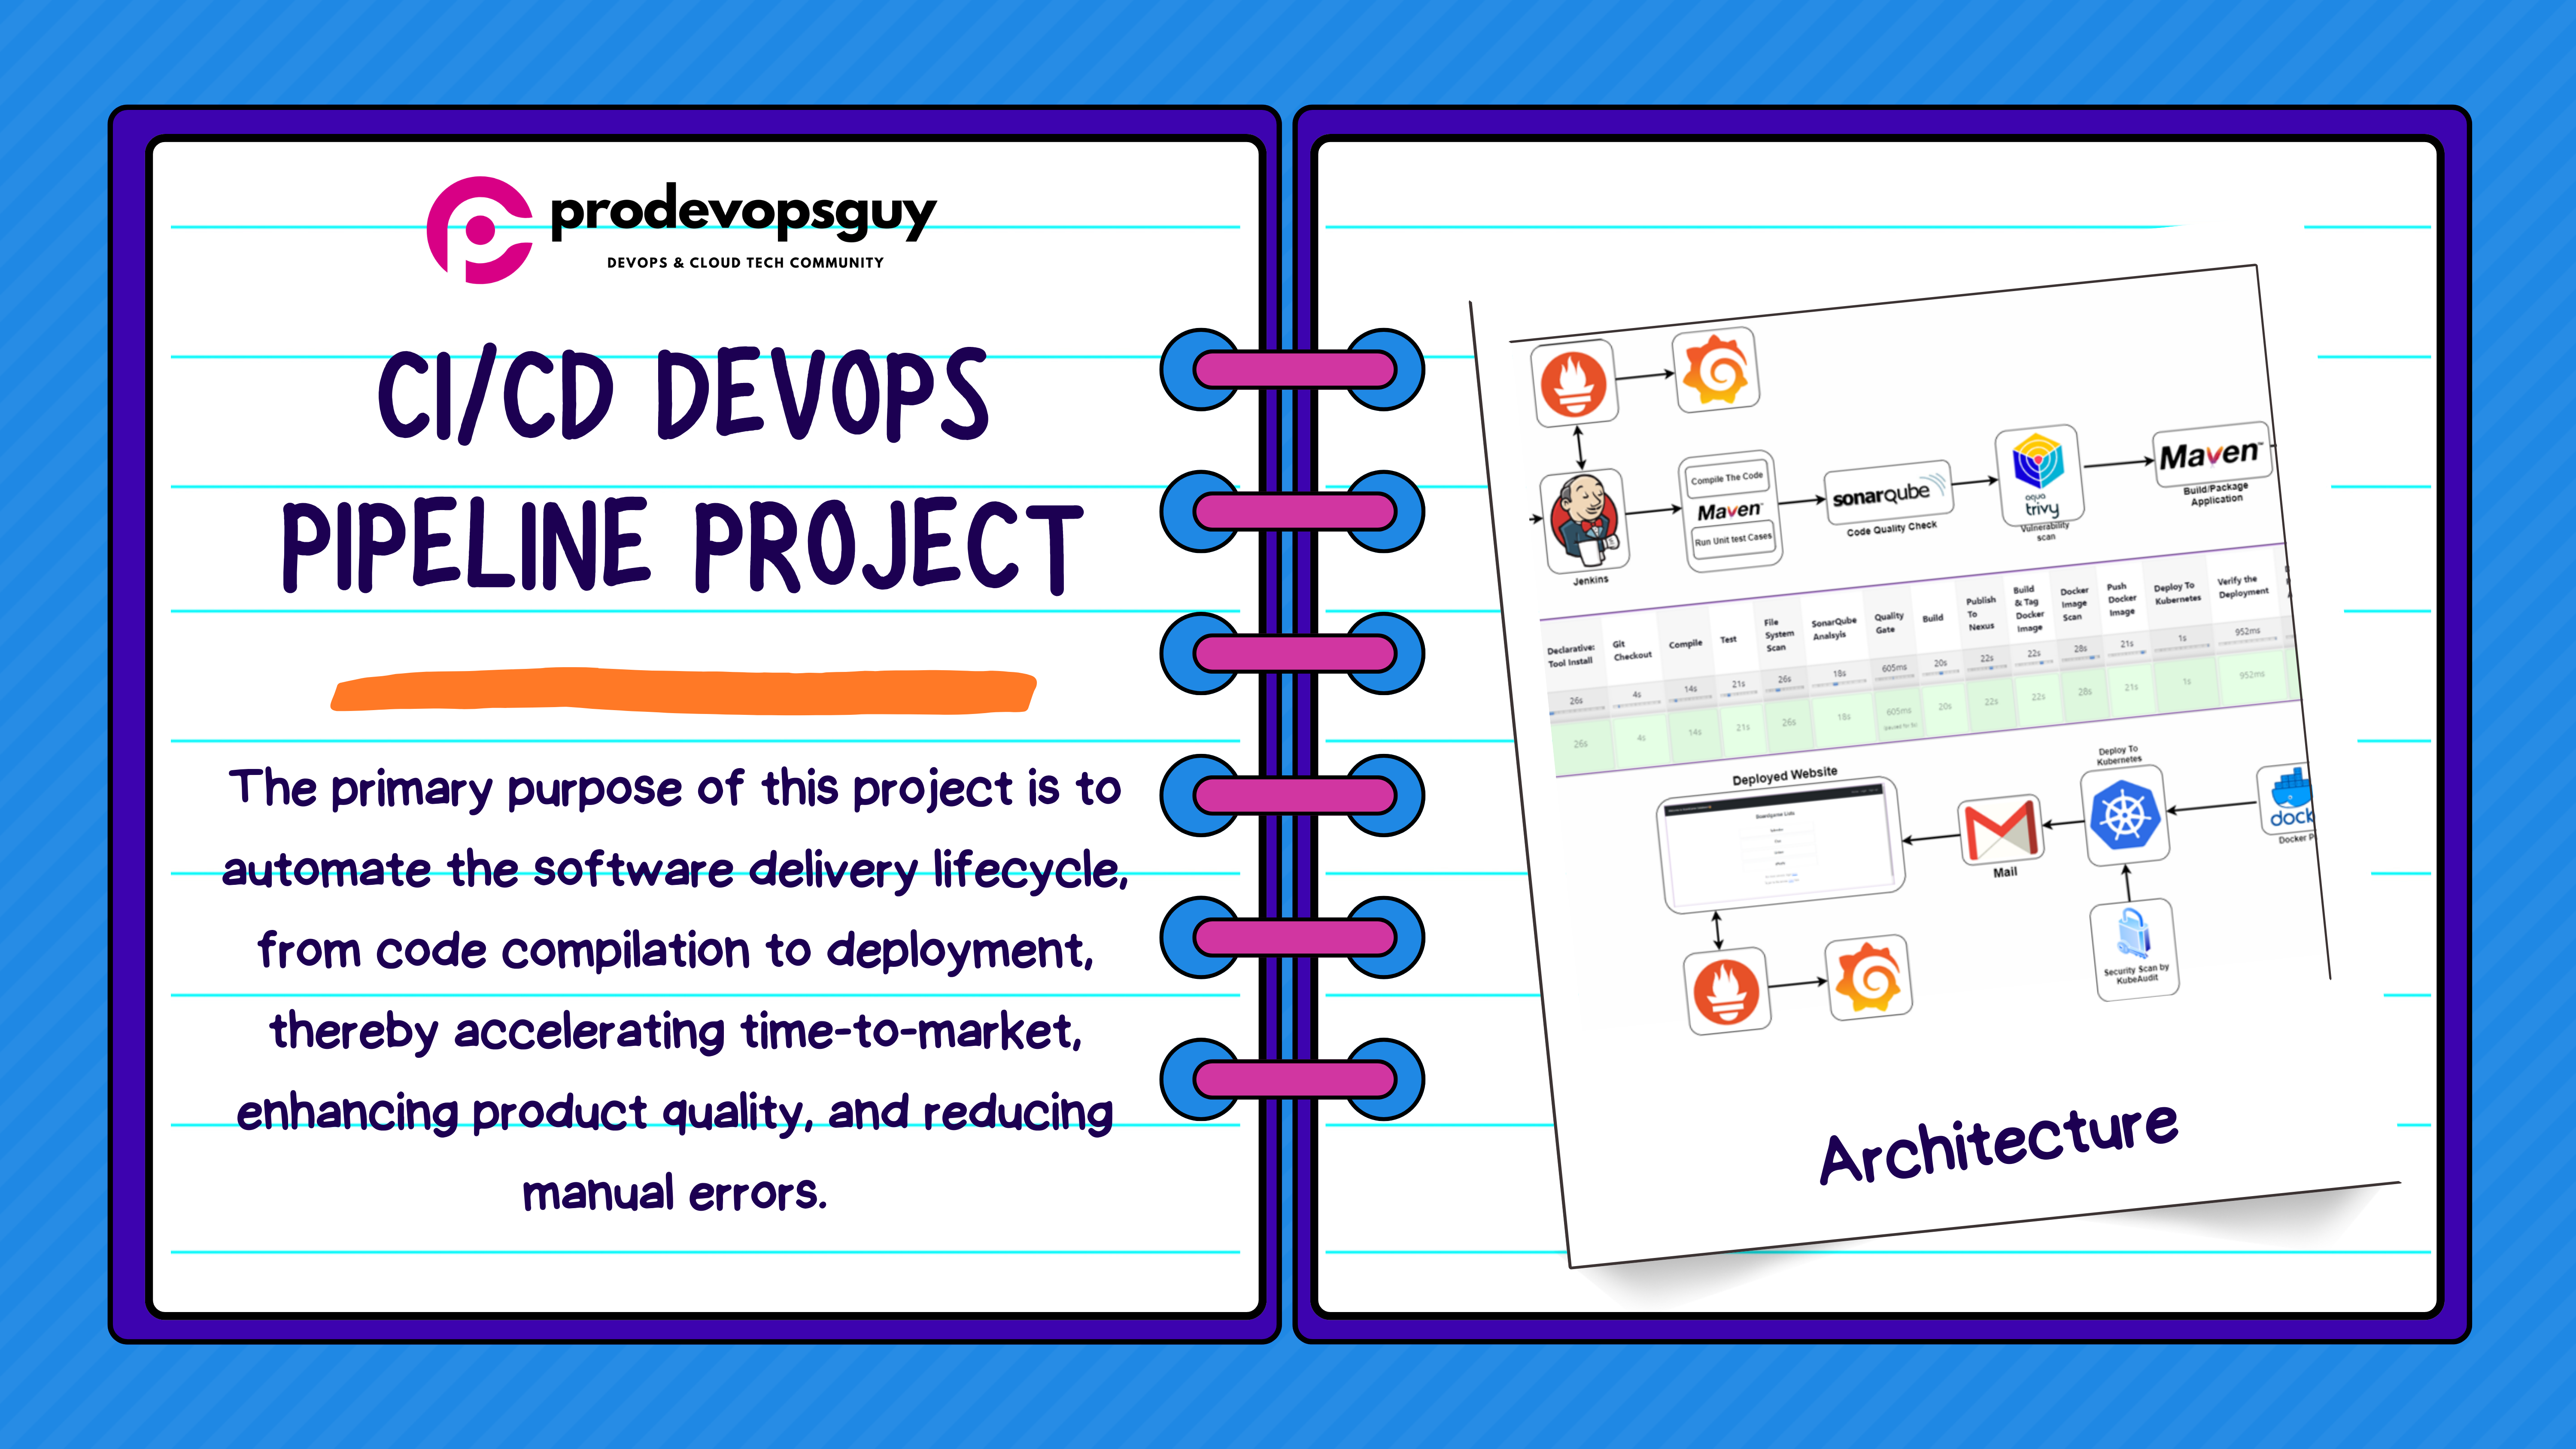
Real-world Prometheus Deployment: A Practical Guide for Kubernetes Monitoring
𝑪𝒍𝒐𝒖𝒅 𝒂𝒏𝒅 𝑫𝒆𝒗𝑶𝒑𝒔 𝑻𝒆𝒄𝒉 𝑪𝒐𝒎𝒎𝒖𝒏𝒊𝒕𝒚 || 𝑷𝒓𝒐𝑫𝒆𝒗𝑶𝒑𝒔𝑮𝒖𝒚 🤖 https://t.me/prodevopsguy 👋 Hi there! We are ProDevOpsGuy, a passionate DevOps enthusiast Tech Community with a strong belief in the power of automation and collaboration to drive innovation. 🚀 I thrive in bridging the gap between development and operations, creating seamless and efficient software delivery pipelines. My journey in the world of DevOps has allowed me to blend my technical skills with a knack for problem-solving, enabling me to contribute effectively to agile and dynamic environments. 💡 With a keen interest in continuous integration, continuous delivery (CI/CD), containerization, and orchestration, I've had the privilege to explore cutting-edge technologies like Docker, Kubernetes, Jenkins, and Ansible. I find joy in designing scalable and resilient infrastructures that enable teams to deploy applications faster and with greater confidence. 🌐 Beyond the tech realm, I'm an advocate for DevOps culture, emphasizing collaboration, communication, and a relentless pursuit of improvement. I'm always eager to connect with fellow professionals, exchange insights, and explore opportunities to collaborate on exciting projects. 📚 When I'm not tinkering with the latest DevOps tools, you can find me indulging in books on technology trends, hiking to rejuvenate, and occasionally experimenting with new coding challenges. 🌟 Let's connect! Whether you're looking to discuss DevOps methodologies, explore partnership opportunities, or simply share experiences, feel free to reach out. I'm excited to be part of the DevOps journey, driving excellence together.
Aim Of This Project:
The primary goal of this Prometheus Lab project is to provide hands-on experience and guidance in setting up a Prometheus monitoring system on a Kubernetes cluster. By following the step-by-step instructions and understanding the associated Kubernetes resources, participants will gain practical insights into deploying Prometheus for efficient system observability.
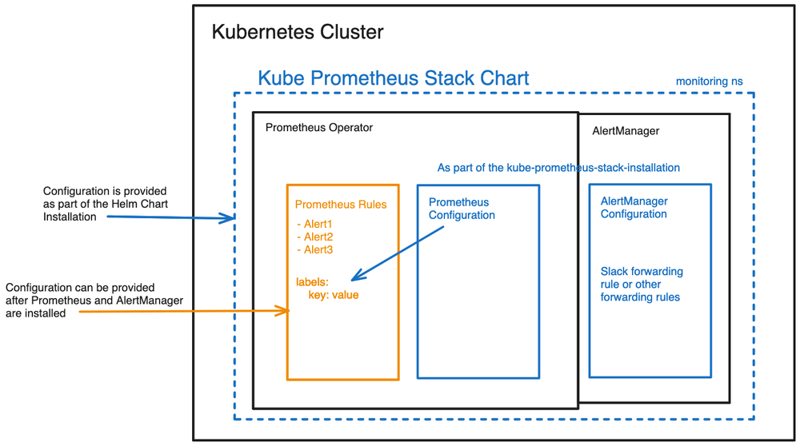
Project architecture:
Prerequisites
To install
k3d, you can use the following command:curl -s https://raw.githubusercontent.com/rancher/k3d/main/install.sh | bashCheck out my GitHub Repo:
https://github.com/NotHarshhaa/Learning-Prometheus.gitCreate a Namespace for
Monitoring:kubectl create namespace monitoringAdd Helm Repository:
 helm repo add prometheus-community https://prometheus-community.github.io/helm-charts
 helm repo update
Store Default values.yaml
helm show values prometheus-community/kube-prometheus-stack > values.yamlInstall
kube-prometheus-stackHelm Chart inmonitoringNamespace:helm install prometheus-stack prometheus-community/kube-prometheus-stack -n monitoringVerify Deployment, after some time:
kubectl get pods -n monitoring
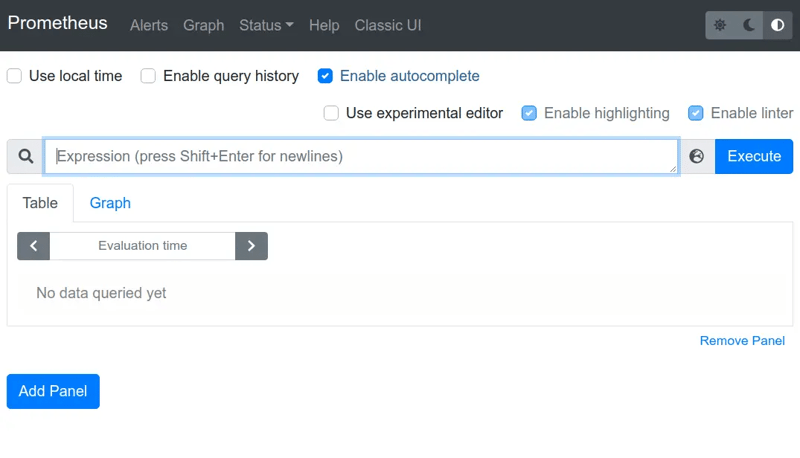
Access Prometheus Dashboard:
run the following command to access the Prometheus UI
kubectl port-forward svc/prometheus-stack-prometheus -n monitoring 9090:9090
- Open your web browser and navigate to
http://localhost:9090to access the Prometheus dashboard.
Access Grafana Dashboard:
run the following command to access the Grafana UI
kubectl port-forward svc/prometheus-stack-grafana -n monitoring 8080:80
- Open your web browser and navigate to
http://localhost:8080.
Login with the default credentials:
Username: admin. Retrieve the password using the following command:
kubectl get secret prometheus-stack-grafana -n monitoring -o jsonpath='{.data.admin-password}' | base64 --decode ; echo
Change in values.yaml
In order to select AltermanagerConfig, we need to change our values.yaml file.
Search in values.yaml for alertmanagerConfigSelector
then replace that section with the following section
altermanagerConfigSelector:
    matchLabels:
    release: prometheus
Apply our k8s-yaml resources:
run the following command to deploy all resources with crds in k8s.
kubectl apply -f <your-path>/k8s-yaml/
Lets Understand All Kubernetes resources:
Deployment
Let's break down the Kubernetes Deployment YAML file in a clear and simple way:
API Version and Kind:
apiVersion: apps/v1
kind: Deployment
This part specifies the API version (apps/v1) and the type of Kubernetes resource (Deployment) we're defining.
Metadata:
metadata:
  name: my-deployment
  labels:
    app: api
In this part, we provide metadata for our Deployment. The name is set to my-deployment, and it carries a label (app: api) for identification.
Specification (spec):
Selector:
selector:
  matchLabels:
    app: api
Here, we define a selector with labels. Pods controlled by this Deployment will have labels matching app: api.
Template:
template:
  metadata:
    labels:
      app: api
  spec:
In the template, we describe the pods created by our Deployment. Metadata labels are set, ensuring they match the selector labels.
Pod Specification (spec inside the template):
    containers:
      - name: mycontainer
        image: panchanandevops/myexpress:v0.1.0
        resources:
          limits:
            memory: "128Mi"


            cpu: "500m"
        ports:
          - containerPort: 3000
Within the pod, we define a container named mycontainer. It uses the Docker image panchanandevops/myexpress:v0.1.0, has resource limits for memory and CPU, and exposes port 3000.
Service
Let's break down the Kubernetes Service YAML file in a clear and simple way:
API Version and Kind:
apiVersion: v1
kind: Service
This section specifies the API version (v1) and the type of Kubernetes resource (Service) we're defining.
Metadata:
metadata:
  name: my-service
  labels:
    job: node-api
    app: api
Here, we provide metadata for our Service. The name is set to my-service, and it carries labels for identifying the associated job (node-api) and application type (api).
Specification (spec):
spec:
  type: ClusterIP
  selector:
    app: api
  ports:
    - name: web
      protocol: TCP
      port: 3000
      targetPort: 3000
In this part, we define the specifications for our Service:
type: ClusterIP: Specifies that the Service is of type ClusterIP.selector: Used to match pods for this service, and in this case, it selects pods with the labelapp: api.ports: Defines a port namedwebwith TCP protocol, available on port3000, targeting the pods on their port3000.
ServiceMonitor
Let's break down the Kubernetes ServiceMonitor YAML file in a clear and simple way:
API Version and Kind:
apiVersion: monitoring.coreos.com/v1
kind: ServiceMonitor
This section specifies the API version (monitoring.coreos.com/v1) and the type of Kubernetes resource (ServiceMonitor) we're defining.
Metadata:
metadata:
  name: api-service-monitor
  labels:
    release: prometheus
    app: prometheus
Here, we provide metadata for our ServiceMonitor. The name is set to api-service-monitor, and it carries labels for release association (release: prometheus) and identifying the application type (app: prometheus).
Specification (spec):
spec:
  jobLabel: job
  selector:
    matchLabels:
      app: api
  endpoints:
    - port: web
      path: /swagger-stats/metrics
In this part, we define the specifications for our ServiceMonitor:
jobLabel: job: Specifies the label (job) used to identify the job for Prometheus.selector: Used to match pods for monitoring; it selects pods with the labelapp: api.endpoints: Defines the endpoints to scrape metrics. In this case, it specifies a port namedweband the path/swagger-stats/metricsto fetch metrics from.
PrometheusRules
Let's break down the Kubernetes PrometheusRules YAML file in a clear and simple way:
API Version and Kind:
apiVersion: monitoring.coreos.com/v1
kind: PrometheusRule
This section specifies the API version (monitoring.coreos.com/v1) and the type of Kubernetes resource (PrometheusRule) we're defining.
Metadata:
metadata:
  name: api-prometheus-rule
  labels:
    release: prometheus
Here, we provide metadata for our PrometheusRule. The name is set to api-prometheus-rule, and it carries labels for release association (release: prometheus).
Specification (spec):
spec:
  groups:
    - name: api
      rules:
        - alert: down
          expr: up == 0
          for: 0m
          labels:
            severity: Critical
          annotations:
            summary: Prometheus target missing {{$labels.instance}}
In this part, we define the specifications for our PrometheusRule:
groups: An array of rule groups. In this case, we have one group namedapi.name: api: Name of the rule group.rules: An array of rules within the group.alert: down: Name of the alert.expr: up == 0: Expression to trigger the alert when the metric 'up' is equal to 0.for: 0m: Minimum duration for which the alert condition must be true to trigger the alert.labels: Additional labels associated with the alert (e.g., severity).annotations: Annotations provide additional information about the alert (e.g., summary).
Alertmanagerconfig
Let's break down the Kubernetes Alertmanagerconfig YAML file in a clear and simple way:
API Version and Kind:
apiVersion: monitoring.coreos.com/v1
kind: AlertmanagerConfig
This section specifies the API version (monitoring.coreos.com/v1) and the type of Kubernetes resource (AlertmanagerConfig) we're defining.
Metadata:
metadata:
  name: alertmanager-config
  labels:
    release: prometheus
Here, we provide metadata for our AlertmanagerConfig. The name is set to alertmanager-config, and it carries labels for release association (release: prometheus).
Specification (spec):
Part 1: Route Configuration:
   spec:
     route:
       groupBy: ["severity"]
       groupWait: 30s
       groupInterval: 5m
       repeatInterval: 12h
       receiver: "team-notifications"
Part 2: Receiver Configuration:
   spec:
     receivers:
       - name: "team-notifications"
         emailConfigs:
           - to: "team@example.com"
             sendResolved: true
- name: "team-notifications": Name of the receiver.emailConfigs:Email-specific configuration.- to: "team@example.com": Email address to which notifications are sent.sendResolved: true: Indicates whether to send notifications when alerts are resolved.